


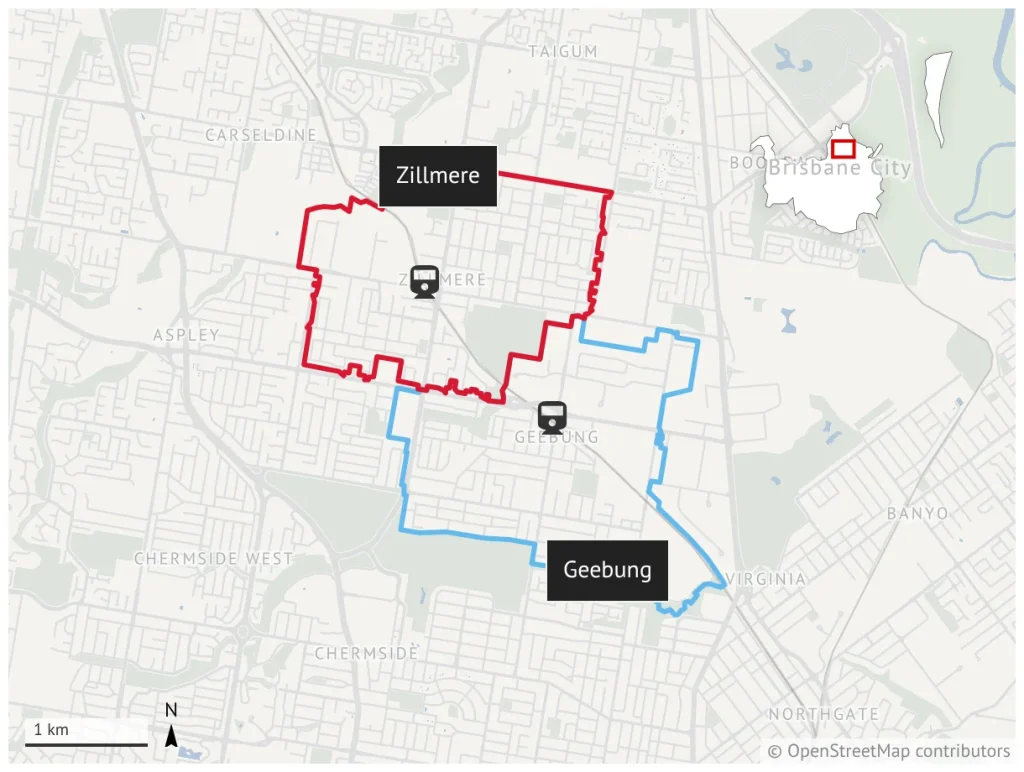
You can board a train at Zillmere and arrive at Geebung in minutes.
But new research from the University of Queensland shows the difference in median age of death between men living near those two stations is 10 years.
The study, published in the Health Promotion Journal of Australia, mapped median age of death across Queensland’s rail network. Using train stations as geographic markers, researchers highlighted how health outcomes can diverge sharply within just a few kilometres.

Along the Redcliffe Peninsula line, men living near Zillmere station recorded a median age of death of 72. Near Geebung station, the figure was 82.
Same rail line. Two stops apart. A decade of difference.
The study measures median age of death — the age at which people in an area have actually died — rather than projected life expectancy. While different from formal life expectancy modelling, it remains a strong indicator of embedded health disadvantage.

How the Research Was Conducted
The research was led by Associate Professor Jonathan Olsen from UQ’s Institute for Social Science Research, alongside Associate Professor Mark Robinson, Professor Lisa McDaid and Professor Jonathan Corcoran.
By overlaying mortality data onto Queensland’s rail map, the team created a clear, place-based framework that residents and policymakers can easily interpret. Stations became reference points for comparing outcomes along shared transport corridors.


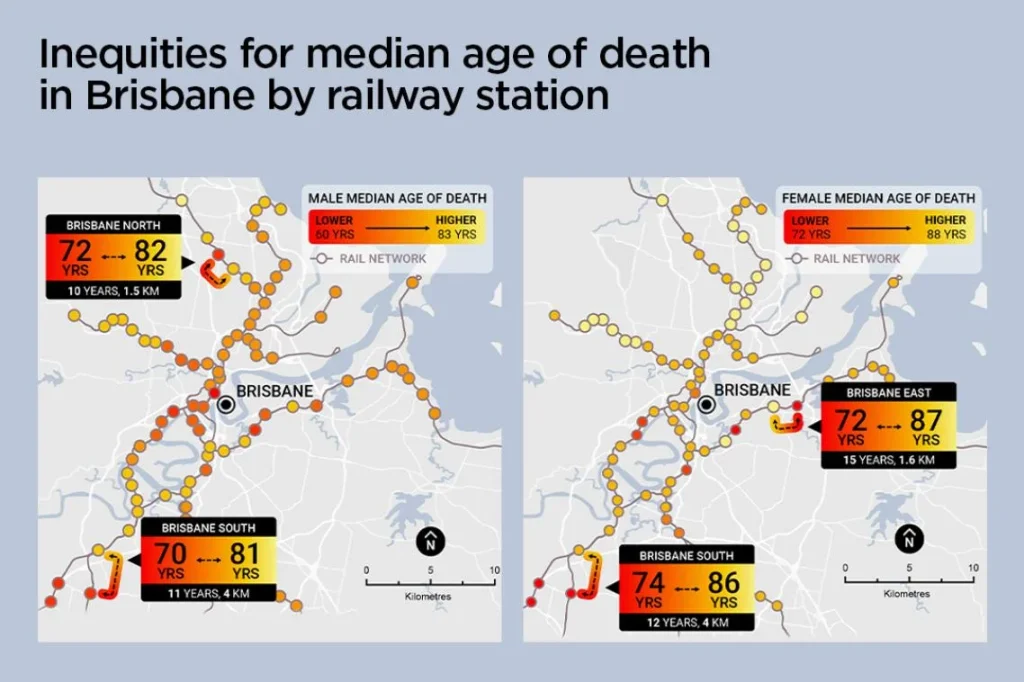
Across Queensland, the median age of death for women ranged between 68 and 88. For men, it ranged from 60 to 83. The Zillmere–Geebung gap sits within that broader statewide variation.
The Pattern Repeats Across Brisbane
The Redcliffe Peninsula line is not an isolated example.
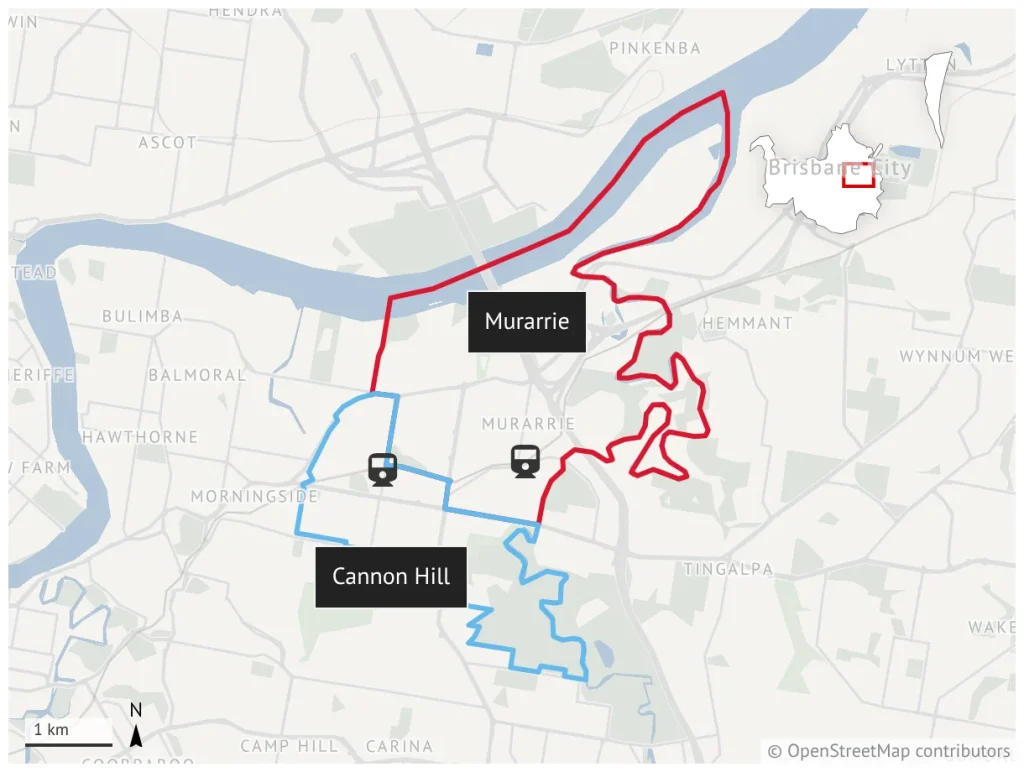
On the Cleveland line, women near Murarrie station recorded a median age of death 15 years lower than women near Cannon Hill, despite being just 1.6 kilometres apart.
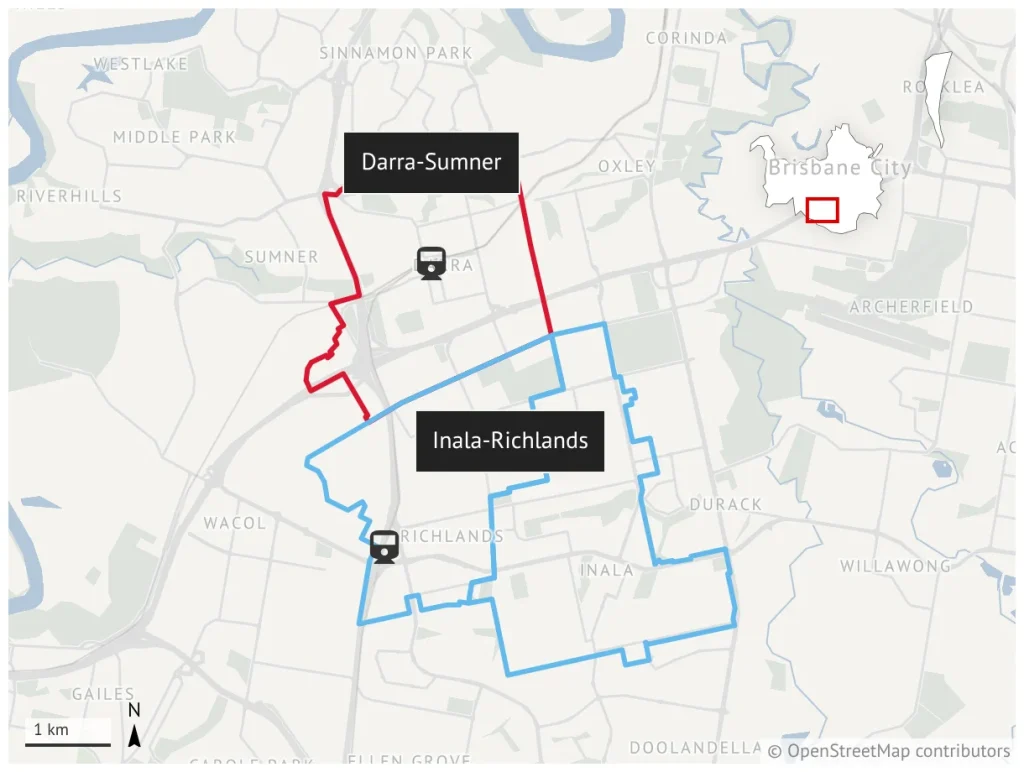
South of the CBD, men in the Inala–Richlands area recorded a median age of death of 70 — 11 years below men in Darra–Sumner. For women in those same areas, the gap reached 12 years.
Researchers link these differences to a mix of income levels, housing security, education access, employment opportunity, family structure and access to services and green space.
What the Findings Are Meant to Do
The authors stress the data is not designed to stigmatise suburbs. Instead, it provides an evidence base for targeted, place-based investment — from park upgrades and active travel infrastructure to community health initiatives.
Similar transport-mapped studies have been conducted in Glasgow, London and New York, allowing governments to track whether investment narrows gaps over time.
The full research paper is available here. UQ’s Institute for Social Science Research can be contacted through issr.uq.edu.au. Maps and media resources from the study are available through the UQ newsroom at news.uq.edu.au.
For Zillmere and Geebung residents, the takeaway is simple but confronting: postcode can shape health outcomes.
Two stations. Ten years.
Published 2-March-2026.